
Cross-species core torpor transcriptome in four hibernating mammals
A consistency meta-analysis of HGEA expression data across four hibernating mammals, benchmarked against mouse daily torpor, identifying a 53-gene core torpor program with stage-resolved, reversible dynamics.
Biological interpretation
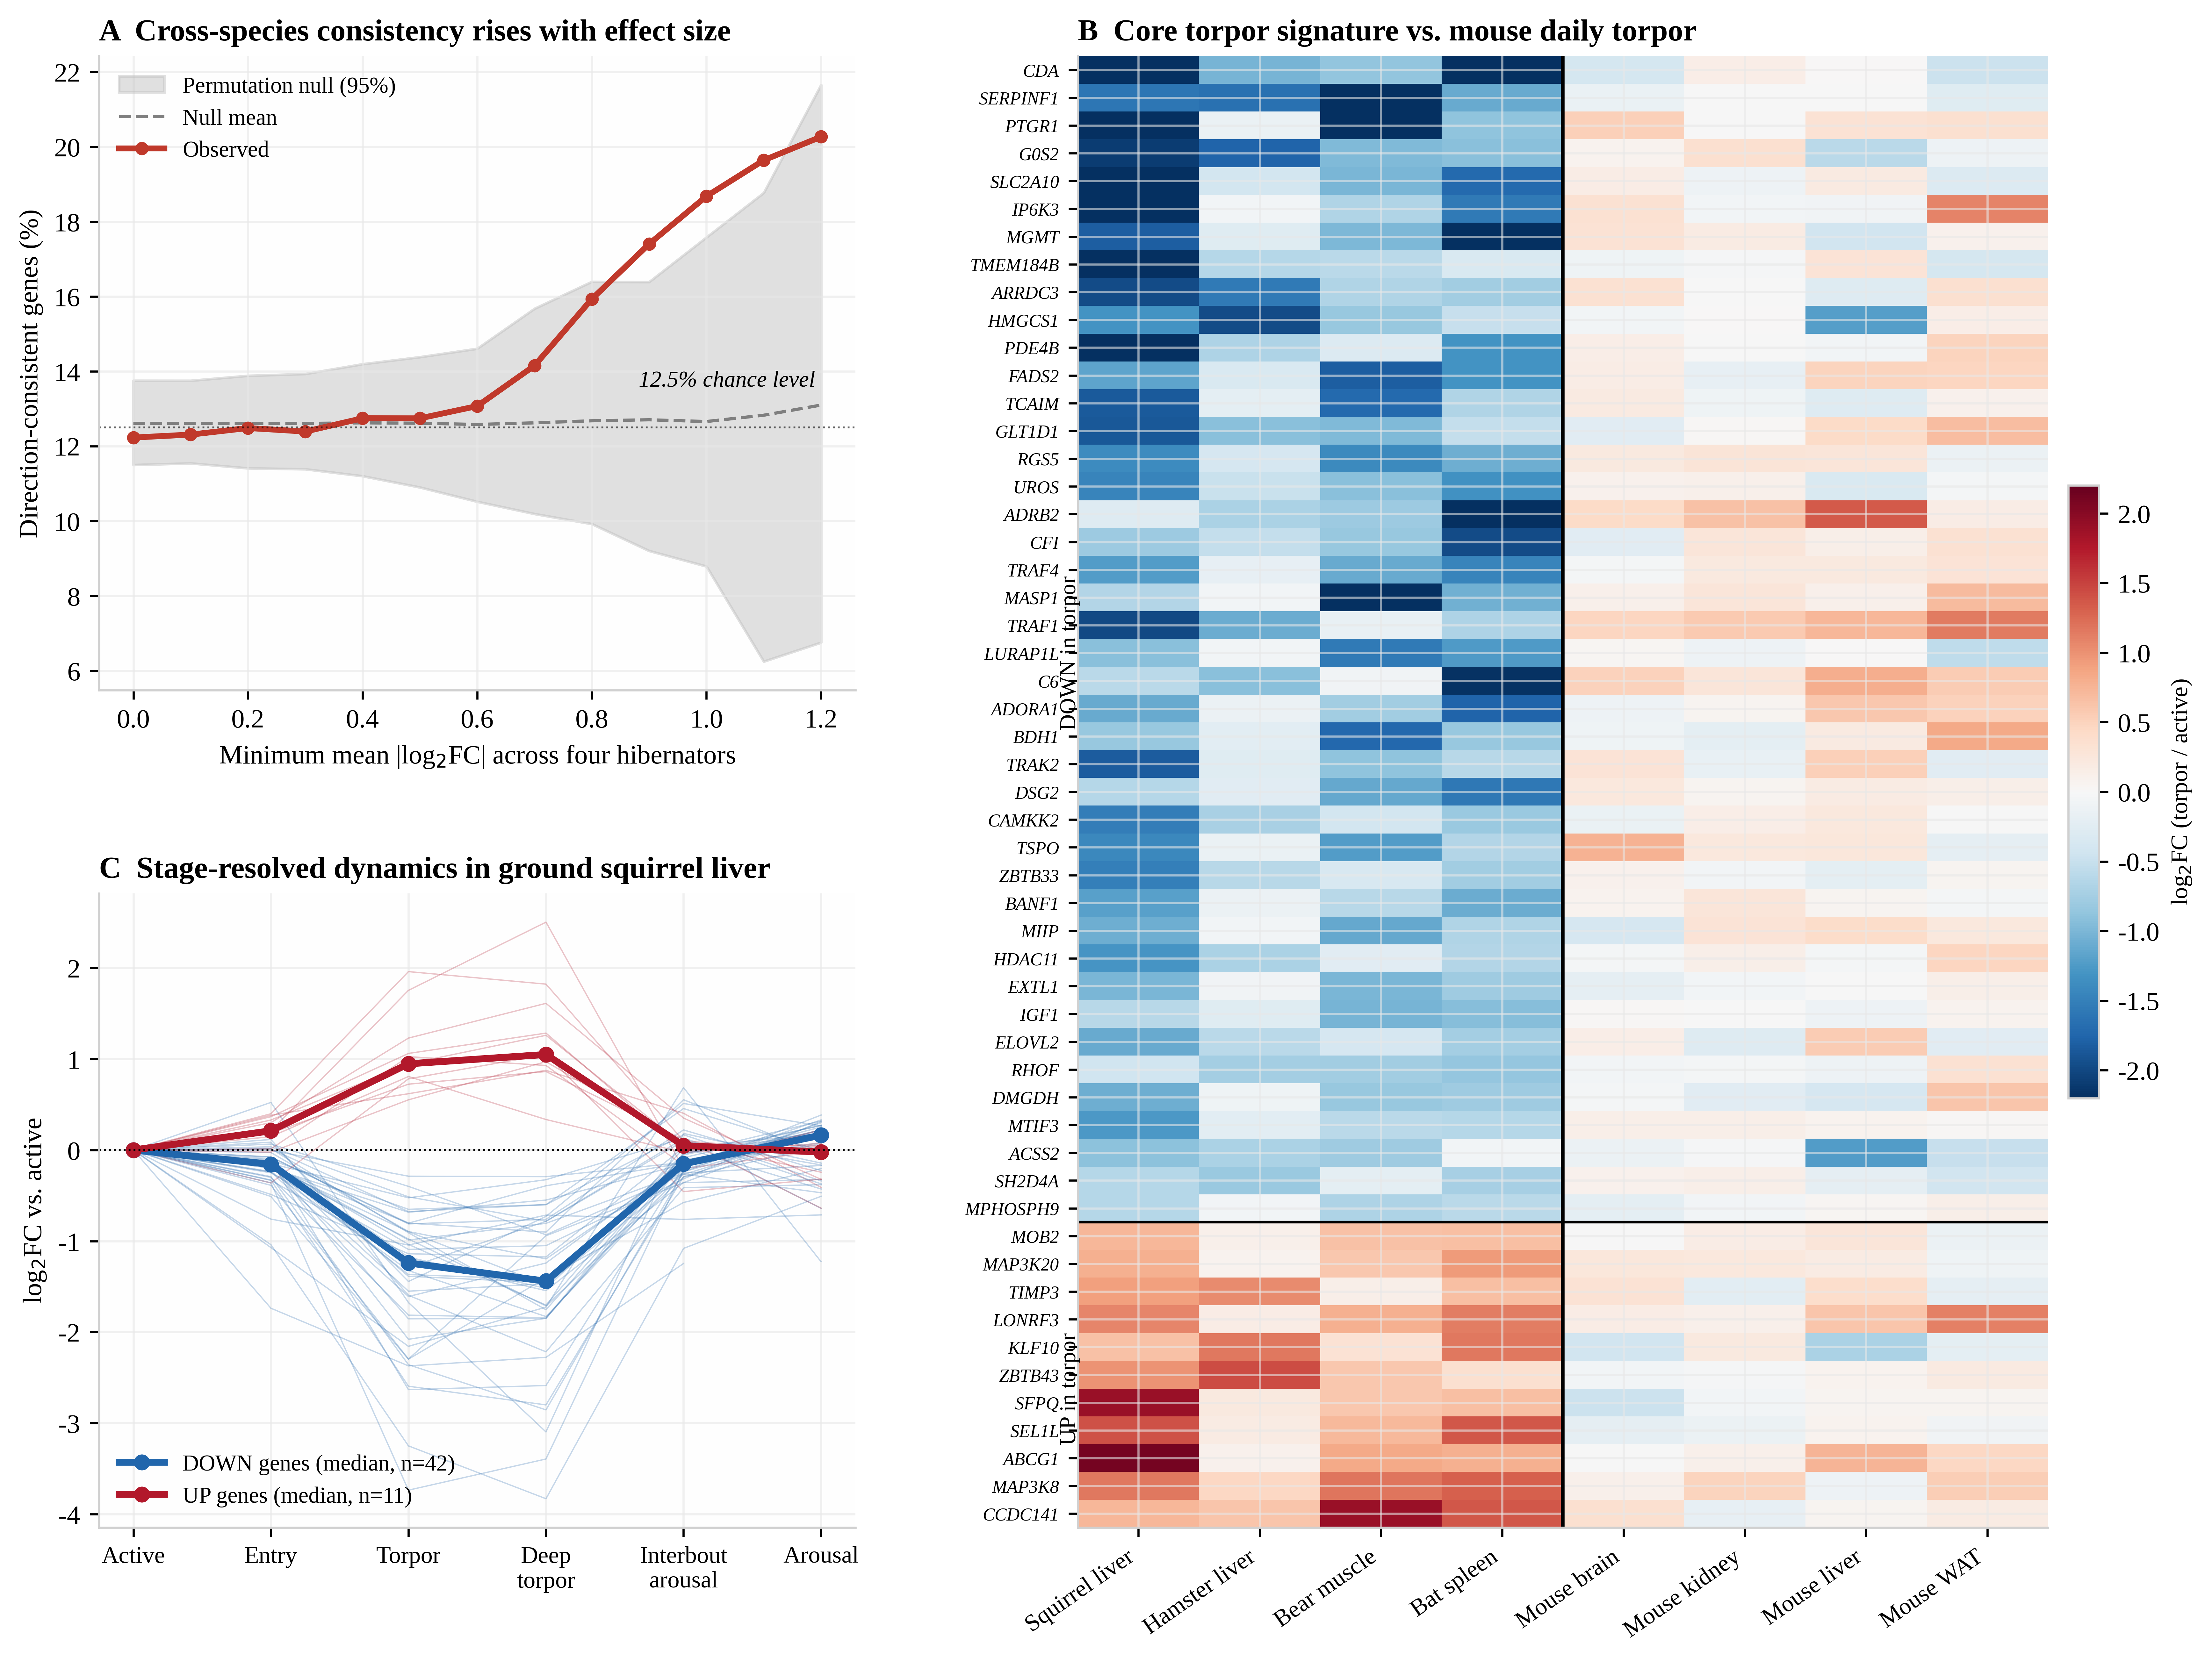
Hibernation-associated expression responses are largely species- and tissue-specific. Direction consistency across the four hibernators equals the 12.5% chance level for weakly changing genes, but rises monotonically with effect size, indicating a small, statistically significant conserved core. The 53-gene signature couples metabolic and immune suppression (down-regulated) with proteostasis and extracellular matrix protection (up-regulated), and its engagement tracks torpor depth reversibly in stage-resolved ground squirrel liver data.
Together with the negative coding-sequence selection result for UCP1 (release 2026.10.25), this release supports a model in which hibernation adaptation acts mainly through regulation of a compact shared expression program rather than through widespread protein-coding convergence. Fifty of the 53 core genes do not respond concordantly in mouse daily torpor, so deep hibernation engages a regulatory layer that daily torpor lacks. Those 50 hibernator-biased genes are candidate targets for dormancy-mimetic interventions in organ preservation and ischemia protection. Those are follow-up hypotheses, not findings established by this release.
Each hibernator contrast uses a different tissue, and the bat and hamster contrasts have small replication. Only fold-change direction and magnitude within each contrast are compared across species, never absolute TPM values. Consistency statistics describe this dataset and sampling, not all dormancy states or tissues.
Data and methods
- Define within-species contrasts. Dormant versus active states per species and tissue. Ground squirrel liver, Torpor plus Deep Torpor vs Active. Hamster liver, Torpor vs Active. Brown bear skeletal muscle, Hibernation vs Active. Horseshoe bat spleen, Torpor vs Active. Mouse brain, kidney, liver and white adipose tissue, Torpor vs Active.
- Compute per-gene effect sizes. log2 fold change of mean TPM with a 0.1 pseudocount, plus a two-sided Mann-Whitney P value when both groups have at least three runs.
- Test cross-species consistency. For the 3,306 genes quantified in all four hibernator contrasts, require the same direction of change in every hibernator.
- Assess enrichment above chance. Shuffle gene labels within each hibernator contrast and repeat the consistency count 2,000 times to obtain empirical P values.
- Benchmark and validate. Classify core genes against mouse daily torpor in four tissues, and validate direction agreement in an independent ground squirrel retina contrast.
| Quality-control measure | Result |
|---|---|
| HGEA records screened | 5,974,348 across 6 species, 9 tissues, 8 stages |
| Hibernator contrasts | Squirrel liver 5 vs 12; hamster liver 3 vs 3; bear muscle 7 vs 7; bat spleen 2 vs 2 runs |
| Mouse comparison layer | Four tissues, 8 torpor vs 15-16 active runs each |
| Genes quantified in all four hibernators | 3,306 |
| Independent validation | Squirrel retina, Hibernation vs Active, 6 vs 4 runs |
Consistency enrichment and core signature
| Candidate class | Candidates | Direction-consistent | Rate | Null mean | Permutation P |
|---|---|---|---|---|---|
| All expression-qualified genes | 3,286 | 402 | 12.2% | 413.3 | 0.750 |
| mean |log2FC| ≥ 0.8 | 433 | 69 | 15.9% | 54.8 | 0.023 |
| mean |log2FC| ≥ 1.0 | 182 | 34 | 18.7% | 23.0 | 0.015 |
| ≥3 hibernators at ≥1.5-fold (core set) | 282 | 53 | 18.8% | 35.8 | 0.003 |
The core signature comprises 42 down-regulated genes, covering fatty acid and cholesterol synthesis (FADS2, ELOVL2, HMGCS1, ACSS2), glucose transport (SLC2A10), growth signaling (IGF1, ADRB2), complement and immune factors (C6, CFI, MASP1, TRAF1, TRAF4), cell-cycle control (G0S2) and neuromodulatory signaling (ADORA1), and 11 up-regulated genes, covering proteostasis (SEL1L, LONRF3), matrix protection (TIMP3), cholesterol efflux (ABCG1) and stress kinases (MAP3K8, MAP3K20).
| Mouse daily-torpor layer | Genes | Definition |
|---|---|---|
| Hibernator-biased | 50 | No concordant strong response in mouse torpor |
| Torpor-generic | 1 (MAP3K8) | Concordant strong response in at least two mouse tissues |
| Reversed in mouse | 2 | Opposite-direction strong response in at least two mouse tissues |
Key output files
The complete archive additionally contains the run-level TPM subset, per-contrast statistics, the analysis script and this report. SHA-256 checksums accompany the downloaded files.